
Let me be blunt: open rates are overrated.
I know that's a controversial thing to say. Sales teams obsess over open rates. Marketing dashboards highlight them. But here's the truth—you can have a 60% open rate and still generate zero revenue.
I've seen it happen. A client came to me celebrating their "amazing" email campaign with a 45% open rate. When I asked about conversions, they went quiet. Turns out, they had generated exactly $0 in revenue from that campaign.
The problem? They were measuring the wrong things. They optimized for vanity metrics instead of metrics that actually move the needle on revenue.
In this guide, I'm going to show you the exact metrics you should be tracking to drive real revenue growth. No fluff. No vanity metrics. Just the data that matters.
The Problem with Traditional Email Metrics
Most sales teams track these "standard" email metrics:
- Open rate
- Click-through rate (CTR)
- Bounce rate
- Unsubscribe rate
These aren't useless—they're just incomplete. They tell you about engagement, but engagement doesn't pay the bills. Revenue pays the bills.
Here's why these traditional metrics fall short:
Open Rates Are Increasingly Unreliable
Apple's Mail Privacy Protection (MPP) broke open rates. MPP pre-loads email images, which triggers open tracking pixels even if the recipient never actually reads the email. For B2B campaigns targeting iOS users, this can inflate open rates by 20-40%.
Translation: Your "35% open rate" might really be 20% or less.
Click-Through Rates Don't Tell You Intent
Someone clicking a link doesn't mean they're interested in buying. They might be curious. They might have clicked by accident. They might be a competitor researching you.
I've seen campaigns with 8% CTR generate fewer qualified leads than campaigns with 2% CTR. Why? Because the 8% CTR campaign was attracting tire-kickers, while the 2% CTR campaign was attracting serious buyers.
Volume Metrics Hide Quality Issues
Tracking total opens or total clicks can be misleading. You might have 1,000 opens, but if 900 of them are from unqualified prospects, you're wasting time and money.
The Revenue-Driving Metrics You Should Track Instead
Here are the metrics that actually correlate with revenue growth:
1. Reply Rate (The Most Underrated Metric)
Reply rate is the percentage of recipients who respond to your email. Not click a link—actually hit reply and start a conversation.
Why it matters: Replies indicate genuine interest. When someone takes the time to write back, they're engaged and considering your offer. This is especially true for outbound sales emails.
What's a good reply rate?
- Cold outbound: 1-3% is average, 5-8% is excellent
- Warm outbound: 5-10% is average, 15-20% is excellent
- Follow-up emails: 10-15% is average, 20-30% is excellent
How to improve it:
- End emails with specific, low-friction questions
- Personalize based on real research about the recipient
- Offer value before asking for anything
- Keep emails short—under 125 words performs best
2. Conversion Rate by Segment
Don't just track overall conversion rate—track it by customer segment, industry, company size, and buyer persona.
Why it matters: This tells you where to focus your efforts. You might discover that enterprise companies convert at 12% while SMBs convert at 3%. That's critical intelligence for resource allocation.
How to track it:
- Tag contacts by segment in your CRM
- Use UTM parameters to track segment-specific campaigns
- Create separate email lists for each key segment
- Calculate conversion rate = (Conversions / Total Sends) x 100
Action step: Identify your top 3 segments and calculate their individual conversion rates this week.
3. Email-Attributed Revenue
This is the total revenue generated from customers who engaged with your email campaigns at any point in their buying journey.
Why it matters: This is the ultimate metric. It directly connects your email efforts to dollars in the bank.
How to calculate it:
- Track email engagement at the contact level in your CRM
- When a deal closes, check if that contact engaged with email campaigns
- Attribute the deal value to email marketing
- Use multi-touch attribution if email was one of several touchpoints
Pro tip: Set up revenue tracking in your email platform or integrate it with your CRM. Tools like HubSpot, Salesforce, and Pipedrive make this easy.
4. Email Influence on Pipeline
Similar to email-attributed revenue, but focuses on opportunities created rather than closed deals.
Why it matters: This is a leading indicator. If email is filling your pipeline with qualified opportunities, revenue will follow.
What to measure:
- Opportunities created — How many sales opportunities came from email campaigns?
- Pipeline value — What's the total value of opportunities influenced by email?
- Pipeline velocity — How quickly do email-sourced deals move through your pipeline?
Benchmark: For well-executed B2B email campaigns, 20-35% of pipeline should be email-influenced.
5. Customer Lifetime Value (CLV) by Acquisition Channel
Track the lifetime value of customers acquired through email versus other channels.
Why it matters: Email-acquired customers might have different retention rates, upsell potential, and overall value compared to customers from other channels.
I've seen cases where email-acquired customers had 40% higher CLV than customers from paid ads, because email attracted more qualified, engaged prospects.
How to use it: If email-acquired customers have higher CLV, justify investing more in email. If they have lower CLV, investigate why and fix your targeting or messaging.
6. Time-to-Conversion by Email Sequence
Measure how long it takes for prospects to convert after entering different email sequences.
Why it matters: Shorter sales cycles mean faster revenue and lower customer acquisition costs.
What to track:
- Days from first email to demo booking
- Days from demo to closed deal
- Total days in nurture sequence before conversion
Optimization strategy: If your average time-to-conversion is 45 days but your top-performing sequence converts in 30 days, analyze what makes that sequence work and replicate it.
7. Email ROI
Calculate the return on investment for your email campaigns.
Formula:
Email ROI = [(Revenue from Email - Cost of Email Campaign) / Cost of Email Campaign] x 100
Costs to include:
- Email platform subscription fees
- Sales team time spent on email follow-up
- Content creation costs
- Design and development costs
- List acquisition costs
Industry benchmark: Good email marketing delivers 3600% ROI ($36 return for every $1 spent). For B2B sales emails, aim for at least 1000% ROI.
Advanced Metrics for Data-Driven Teams
Once you've mastered the core revenue metrics, level up with these advanced analytics:
8. Engagement Score Over Time
Create a composite engagement score that tracks how a prospect's engagement changes over time across multiple emails.
How to calculate: Assign points for different actions (open = 1 point, click = 3 points, reply = 5 points, meeting booked = 10 points). Track the cumulative score for each prospect.
Why it's powerful: This tells you when prospects are heating up or cooling down. You can trigger personalized interventions based on engagement trends.
9. Email Impact on Deal Size
Compare average deal size for customers who engaged with email nurture campaigns versus those who didn't.
What you might discover: Prospects who engage with educational email content often buy larger packages because they're better informed about your value proposition.
10. Win Rate by Email Engagement Level
Segment your opportunities by email engagement (high, medium, low, none) and calculate win rate for each segment.
Example insights:
- High email engagement: 45% win rate
- Medium engagement: 25% win rate
- Low engagement: 12% win rate
- No engagement: 8% win rate
This data proves the value of email to skeptical stakeholders and helps prioritize follow-up efforts.
How to Build Your Revenue-Focused Email Dashboard
Here's how to set up a dashboard that tracks what matters:
Step 1: Define Your North Star Metric
Pick one primary metric that best represents email success for your business. For most B2B companies, this is either email-attributed revenue or pipeline influenced by email.
Step 2: Identify 3-5 Supporting Metrics
Choose metrics that drive your north star metric. If your north star is email-attributed revenue, your supporting metrics might be:
- Reply rate
- Conversion rate by segment
- Time-to-conversion
- Email ROI
Step 3: Set Up Integrations
Connect your email platform to your CRM. This is non-negotiable for tracking revenue metrics. Popular integrations:
- HubSpot + Gmail/Outlook
- Salesforce + Outreach/SalesLoft
- Pipedrive + Mailchimp
Step 4: Build Your Dashboard
Use a visualization tool like:
- Looker Studio (free, good for startups)
- Tableau (powerful, enterprise-grade)
- Built-in CRM dashboards (HubSpot, Salesforce)
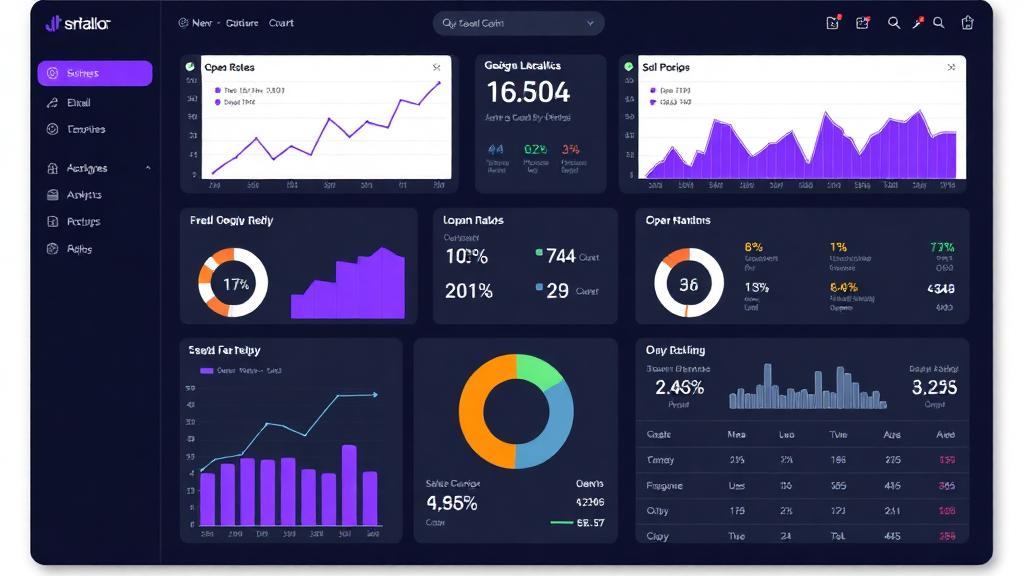
Dashboard layout:
- Top section: North star metric with trend line
- Middle section: Supporting metrics with week-over-week comparisons
- Bottom section: Segment breakdowns and cohort analysis
Step 5: Schedule Regular Reviews
Review your dashboard weekly. Look for:
- Metrics trending in the wrong direction
- Segments underperforming
- Anomalies that need investigation
- Opportunities to double down on what's working
Common Mistakes (And How to Avoid Them)
Mistake 1: Tracking Too Many Metrics
More metrics = better insights. Stick to 5-7 key metrics. Anything more and you'll suffer from analysis paralysis.
Mistake 2: Not Segmenting Your Data
Overall metrics hide important patterns. Always segment by customer type, industry, deal size, and other relevant dimensions.
Mistake 3: Optimizing for Short-Term Metrics
You can game open rates with clickbait subject lines. But that destroys trust and hurts long-term conversion rates. Always balance short-term and long-term metrics.
Mistake 4: Ignoring Qualitative Feedback
Numbers tell you what's happening. Qualitative feedback tells you why. Read reply emails. Talk to sales reps. Survey your customers.
Real-World Case Study
Let me show you what happens when you shift focus to revenue metrics:
A B2B SaaS company was celebrating 40% open rates on their cold outreach campaigns. But they were booking only 2 demos per month from 2,000 emails sent.
We shifted their focus to reply rate and email-attributed pipeline. Here's what we changed:
- Reduced email volume by 60% (focusing on quality over quantity)
- Personalized each email with specific research
- Ended emails with specific, valuable questions
- Tracked replies and pipeline created, not just opens
Results after 3 months:
- Open rate dropped to 32% (but we didn't care)
- Reply rate jumped from 0.8% to 6.2%
- Demos booked increased from 2/month to 18/month
- Email-attributed pipeline grew from $40K to $380K
- Closed revenue from email increased by 425%
That's the power of focusing on metrics that matter.
Your Action Plan
Here's what to do this week:
- Audit your current metrics — What are you tracking today? Which metrics actually correlate with revenue?
- Choose your north star metric — Pick the one metric that best represents email success for your business.
- Set up CRM integration — If you haven't already, connect your email platform to your CRM.
- Calculate baseline metrics — Measure your current reply rate, conversion rate by segment, and email-attributed revenue.
- Build a simple dashboard — Start with 5 key metrics. You can add more later.
- Set improvement goals — Pick one metric to improve by 20% in the next 30 days.
The Bottom Line
Stop obsessing over open rates. Start tracking metrics that actually move the needle on revenue.
The metrics I've outlined in this guide—reply rate, email-attributed revenue, conversion rate by segment, pipeline influence—these are what separate high-performing email programs from mediocre ones.
The companies that figure this out will dramatically outperform their competitors. While everyone else is celebrating vanity metrics, you'll be celebrating real revenue growth.
The data is there. The tools exist. The question is: are you ready to start measuring what matters?
Because at the end of the day, your CFO doesn't care about open rates. They care about revenue. And now you know exactly how to deliver it.