
Email open rates are one of the most discussed—and most misunderstood—metrics in marketing.
Someone shares a benchmark. Another team panics because they're "below average." A third celebrates a high open rate that never turns into revenue.
The truth is simple but uncomfortable:
Email open rates only make sense when you understand industry context, audience intent, and email purpose.
This guide goes deep. We'll cover:
- Realistic email open rate ranges by industry
- Why these numbers differ so much
- What a "good" open rate actually means
- How privacy changes affect open rate reliability
- How AI and automation are influencing open rates
- And how to use benchmarks without misleading yourself
This isn't about chasing vanity metrics. It's about interpreting open rates like a professional.
What an Email Open Rate Actually Tells You (And What It Doesn't)
At its core, an email open rate measures whether someone opened your email. Historically, that signaled interest.
Today, it signals three things more than anything else:
- Sender trust – Do recipients recognize or trust the sender?
- Subject line relevance – Did the subject line earn attention?
- Inbox placement – Did the email land in the primary inbox?
What it does not reliably tell you:
- Whether the email was read
- Whether the message resonated
- Whether it influenced a decision
Open rates are a leading indicator, not a success metric.
A Note on Privacy and Open Rate Accuracy
Before diving into benchmarks, this matters.
Email open tracking is increasingly unreliable due to:
- Apple Mail Privacy Protection (MPP)
- Image prefetching
- Security scanners opening emails automatically
This means:
- Some opens are false positives
- Some real opens aren't tracked
- Absolute numbers matter less than trends
Despite this, open rates remain useful comparatively, especially:
- Across segments
- Over time
- Within the same industry
Just don't treat them as precise truth.
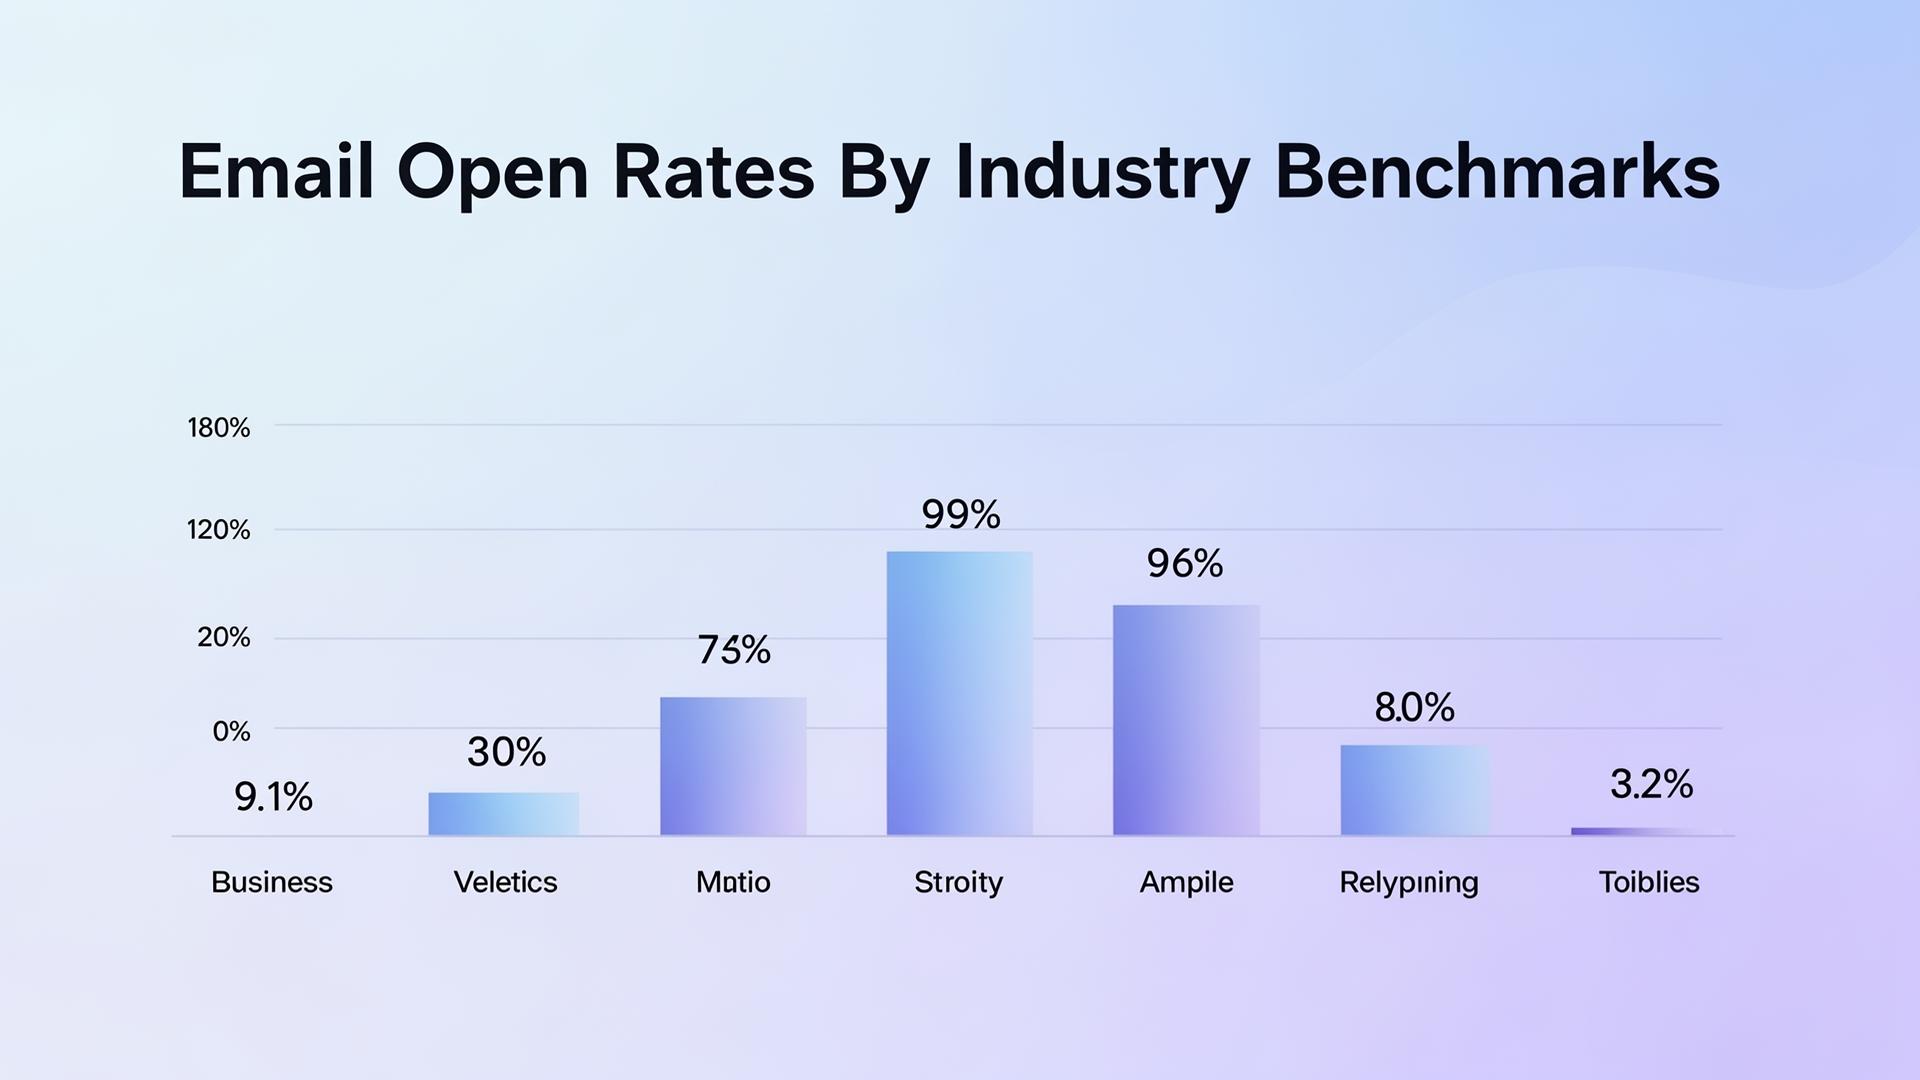
Average Email Open Rates by Industry (Expanded Benchmarks)
The ranges below represent normal, healthy performance for well-run email programs—not best-case scenarios.
B2B / SaaS
Typical open rate: 20%–30%
Why it's lower:
- Intense inbox competition
- High volume of outbound sales emails
- Buyers filter aggressively
What's considered strong:
- Cold outbound: 22%–28%
- Warm outbound or newsletters: 30%+
Open rates here are heavily influenced by:
- Role relevance
- Sender reputation
- Subject line clarity
Technology & Software (Non-SaaS)
Typical open rate: 18%–28%
This includes:
- IT services
- Infrastructure tools
- Dev platforms
Challenges:
- Highly technical audiences
- Strong skepticism toward marketing language
Emails that are: Direct, Clear, Utility-focused outperform clever or hype-driven messaging.
Professional Services (Consulting, Agencies, Legal, Accounting)
Typical open rate: 25%–40%
Why open rates are higher:
- Relationship-driven communication
- Smaller, better-targeted lists
- Higher trust expectations
Strong personalization and relevance can push opens well above 40% in this category.
Financial Services & FinTech
Typical open rate: 20%–35%
Why this range varies:
- Trust sensitivity
- Compliance constraints
- Mixed intent levels
Transactional and educational emails often outperform promotional ones. Clarity beats creativity here—every time.
Healthcare & Medical
Typical open rate: 30%–45%
Reasons for higher performance:
- Regulated environments
- Strong relevance
- High information value
Educational content performs exceptionally well in this industry.
Education & EdTech
Typical open rate: 25%–45%
Why:
- High-intent recipients
- Clear informational needs
- Opt-in audiences
Segmentation is critical. Students, parents, educators, and administrators behave very differently.
E-commerce & Retail
Typical open rate: 15%–25%
Why lower:
- Promotional fatigue
- High send frequency
- Price-driven messaging
Behavioral and transactional emails (order updates, back-in-stock alerts) often exceed 40%.
Media, Publishing & Content Platforms
Typical open rate: 20%–35%
Performance depends on:
- Content quality
- Consistency
- Audience loyalty
Strong editorial brands can outperform industry averages significantly.
Nonprofits & Associations
Typical open rate: 30%–45%
Why:
- Mission-driven engagement
- Emotional connection
- Voluntary opt-ins
Storytelling dramatically affects opens here.
Real Estate
Typical open rate: 20%–30%
Open rates fluctuate based on:
- Market conditions
- Location relevance
- Buyer vs seller intent
Timing matters more than subject lines in this industry.
Manufacturing & Industrial
Typical open rate: 18%–30%
Lower volume, higher specificity. Technical accuracy and relevance matter more than polish.
Why Email Open Rates Differ So Much by Industry
Open rates aren't random. They're structural.
1. Inbox Competition Levels
Industries like SaaS and e-commerce face relentless inbox competition. Healthcare and nonprofits don't.
More competition means:
- Lower baseline open rates
- Higher dependence on relevance
2. Trust and Relationship Dynamics
Industries built on trust (finance, healthcare, professional services) naturally see higher opens. Unknown senders struggle everywhere—but especially in trust-sensitive industries.
3. Audience Intent
High-intent audiences open more.
Examples:
- Students awaiting updates
- Patients reading medical info
- Donors engaging with causes
Low-intent audiences require stronger relevance to earn opens.
4. Frequency Expectations
If an industry trains people to expect daily emails, open rates drop—even if revenue stays healthy. High frequency normalizes ignoring.
What Is a "Good" Open Rate? (Context Matters)
A "good" open rate depends on:
- Industry
- Email type
- Audience warmth
- Funnel stage
Examples:
- 22% is strong for cold B2B outbound
- 22% is weak for customer lifecycle emails
- 35% is average for nonprofits
- 35% is exceptional for high-volume e-commerce
Benchmarks are not targets. They're reference points.
Why Chasing Higher Open Rates Alone Is Dangerous
High open rates don't guarantee results.
A subject line can:
- Create curiosity
- Get the open
- Fail to deliver value
This leads to:
- Short-term open spikes
- Long-term trust erosion
Modern teams treat open rates as:
- A diagnostic signal
- A deliverability indicator
- A subject-line quality check
Not as a success metric.
How AI and Automation Are Changing Email Open Rates
AI doesn't magically boost open rates. It improves the inputs that influence them.
Smarter Subject Line Generation
AI can:
- Generate multiple subject line styles
- Adapt tone by industry
- Test continuously
This improves relevance gradually and consistently.
Better Personalization at Scale
When emails reference real context—not placeholders—recipients are more likely to open future emails. This compounds over time.
Deliverability Protection
AI-driven systems manage:
- Send pacing
- Engagement signals
- Frequency optimization
This protects inbox placement—one of the biggest invisible drivers of open rates.
Platforms like SendroAI focus on this approach: improving relevance, sequencing, and optimization automatically so open rates improve as a byproduct of better execution.
How to Use Industry Open Rate Benchmarks Correctly
This is where most teams go wrong.
1. Compare Only Within Your Industry
Cross-industry comparisons are meaningless.
Always benchmark against:
- Similar audiences
- Similar email types
- Similar funnel stages
2. Segment Before You Evaluate
Break down open rates by:
- Cold vs warm
- Customer vs prospect
- Role or persona
- Geography
Averages hide insight.
3. Track Trends, Not Single Campaigns
A steady climb from 19% to 24% matters more than hitting a generic "average." Trends reveal improvement. Snapshots mislead.
4. Pair Open Rates With Action Metrics
Always view open rates alongside:
- Replies
- Clicks
- Conversions
An open without action is interest—not value.
Final Conclusion: What Email Open Rates by Industry Really Tell You
Email open rates vary by industry for valid reasons:
- Inbox competition
- Trust dynamics
- Audience intent
- Frequency norms
There is no universal benchmark that defines success.
What matters is:
- How you compare within your industry
- Whether open rates trend in the right direction
- And whether opens lead to meaningful outcomes
As inboxes become more crowded, relevance and trust outperform cleverness every time.
Teams that understand this stop chasing numbers—and start building email programs that actually work.